
Where a copy differs from the screenshot
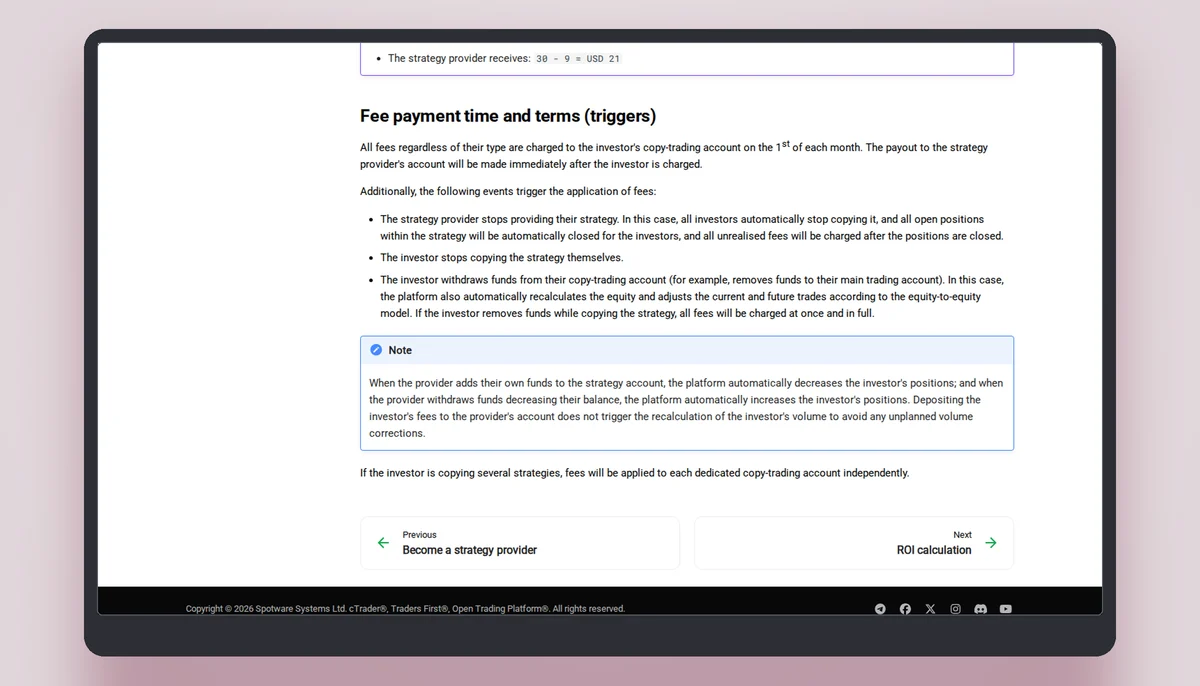
A screenshot shows the provider's account. The follower holds a different account, started later, on a different balance, paying fees the screenshot does not include. This page lists the places where the two part, from the help pages and from 20 strategy cards read on 6 November 2026. The cards are counted, not named.
Fees are paid by the follower
Whatever a provider's record shows, the fees come out of the follower's copy-trading account. The help page lists three types and lets the provider combine them, or charge none. The investor can see them on the Start copying button before copying.
The page defines the strategy return as the return in relation to the account balance the strategy had at the start of the period. Fees paid by followers are not part of that figure.
The three fees and their printed caps
The fees page of the help centre names three fees that a provider may set in any combination, with a cap for each. Source: help.ctrader.com/ctrader-copy/fees-calculation, read on 6 November 2026.
| Fee | Cap printed | What it is charged on |
|---|---|---|
| Performance fee | 40% | Net profit, by the high-water mark model: a fee is charged only on profit above the account's earlier highest value. |
| Management fee | 10% a year | Equity, accrued daily, whatever the strategy does. |
| Volume fee | USD 10 per million | Copied volume, per side: charged when a position opens and again when it closes. |
The help page's own example
A follower allocates USD 1,000 to a strategy with a 10% performance fee, a 5% management fee and USD 5 per million of volume. On USD 700 of net profit the performance fee is USD 70. The management fee is 5% of the allocated equity a year, USD 50, or USD 0.14 a day. One lot of EURUSD at the quote 1.19 carries a volume fee of USD 1.19, opening and closing together. The example is arithmetic on the page's own numbers; it is not a typical case and no card read shows its fees.
When the fees are taken
All fees are charged to the copy-trading account on the 1st of each month. They are also charged when the provider stops the strategy, when the follower stops copying, and when the follower removes funds; in the last case all fees are charged at once and in full. From 4 July 2026 cTrader takes a 30% commission on the fees a provider earns, deducted from the provider's fees, with no additional charge for the investor.
Prices, leverage and the provider's own moves
The platform's front page lists the risks in three short sentences: strategy performance can decline, markets can be volatile, and provider and investor prices may differ because of trading conditions and execution time. The help pages add that a follower with lower leverage may reach stop out earlier, and that a provider's deposits or withdrawals with positions open can cause losses on the followers' copy accounts. No page read gives a figure for any of these.
Where the 20 curves ended, 5 November 2026
Each card draws a small curve of 29 daily points, from 8 October 2026 to 5 November 2026, whose first point is 0 on 7 of the 20 cards and another value on the rest, with no axis label in the data read. The table counts the last point of each curve in four bands, with no card named. Source: ctrader.com/copy/symbols, read on 6 November 2026.
| Last point of the curve | Cards |
|---|---|
| Below zero | 5 |
| 0 to 10 | 5 |
| Above 10 up to 50 | 7 |
| Above 50 | 3 |
What the curves show, and what a beginner can take from them
5 of the 20 curves ended below zero and 15 above it. The same cards print returns from -17% to 113,998%, 8 of them 1,000% or more, and the pages do not state the period of those printed returns. 1 card printing 1,000% or more drew a curve that ended below zero. A curve of 29 days is a short stretch, and nothing is concluded about any card from it. The point is that a very large printed return and a negative stretch can sit on the same card.
The largest fall inside the 29 points
For each curve the largest drop from an earlier high point to a later low point, in the curve's own unit. A curve with no drop counts as none.
| Largest fall in the curve | Cards |
|---|---|
| None | 6 |
| Up to 5 points | 9 |
| 5 to 10 points | 1 |
| More than 10 points | 4 |
How to read the fall table
4 of the 20 curves fell by more than 10 points somewhere inside the 29 days, and the deepest fall was 36.79 points. The unit is the curve's own, which the data does not label; the help page's return charts are measured against the account balance at the start of the period. A fall is not a loss to a particular follower, whose entry could have been anywhere along the curve. It shows that the cards vary in how far they dropped within one month.
In brief
Read next
Beginner questions, answered from the pages
Who pays the provider?
The follower, through the fees charged to the copy-trading account. The platform takes a 30% commission of the provider's fees from 4 July 2026.
Are the fees on the card included in the printed return?
The help page defines the return against the provider's account balance; fees paid by followers are not part of it.
Do the curves predict anything?
No. They are a 29-day stretch, read to count falls, and this site draws no conclusion about any card from them.
When is a fee charged?
On the 1st of each month, when copying is stopped, when the provider stops the strategy and when funds are removed.
The broker this site links to
This site links to FxPro, which cTrader's list marks as a copy-enabled broker. A copied trade is a leveraged contract on a price, not ownership of anything. Read the terms before you decide anything.